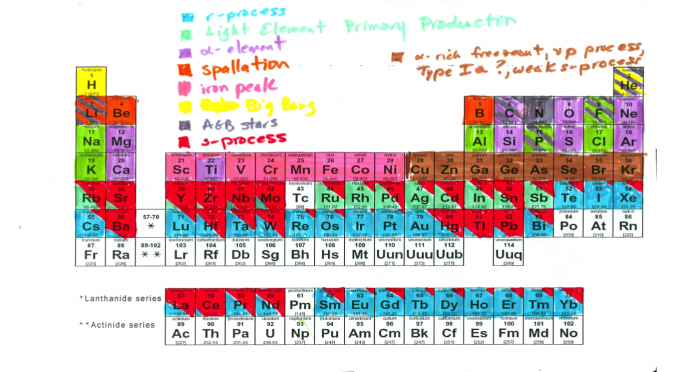
The periodic table color-coded by the source of the element in the solar system, hand-drawn at the 2008 “Back to the Galaxy II” conference. Photo by Jennifer Johnson and Inese Ivans.
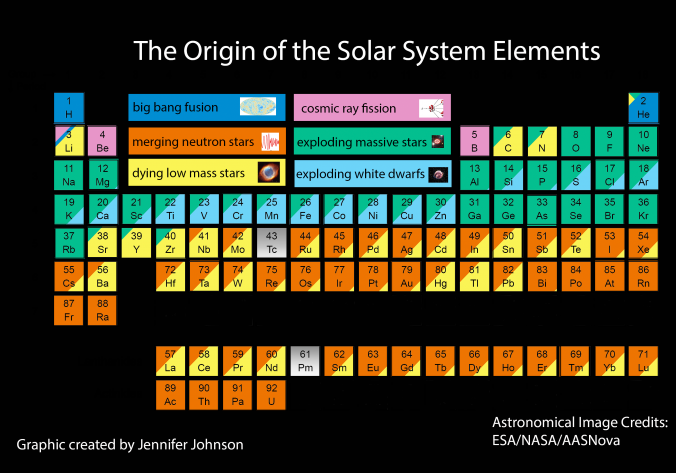
2018 version of the evolving periodic table color-coded by the element’s source.
One of KITP’s goals is to bring together theorists and experimentalists with different expertise to intensively study important issues. One such conference was 2008’s “Back to the Galaxy II,” where astrophysicists interested in understanding the history of the Milky Way gathered at KITP. The conference brought together experts on dark matter, orbital motions, gas dynamics and hydrodynamics, and finding the smallest galaxies around the Milky Way. Our research area, studying the chemical compositions of stars of different ages, was well-represented. The atmospheres of stars are chemical time-capsules of the gas from the time the star was born. Because each element in a star’s atmosphere absorbs light at a characteristic wavelength, we use spectroscopy to infer which elements are present, and their relative abundances. Each type of star produces different elements, in a characteristic lifespan. By measuring the amounts of each element in many stars, we can piece together which and how many of our Galaxy’s stars were born, and when.
The assembled scientists knew that, if we wanted to understand the Galaxy’s evolution, we couldn’t just concentrate on one element. This meant that over 40 elements were appearing on plots during the conference, and if your expertise lay somewhere else, keeping track of which kind of star made which elements was too much to manage. It became a stumbling block in the cross- disciplinary discussions that are so important in making progress on big questions. In the spirit of KITP conferences, we decided to help our fellow astrophysicists by providing a simple graphical version of the periodic table, color-coded by the technical names of the stellar processes that we were all discussing.
One of the unsung benefits of KITP is its close proximity to the community of Goleta, with its drugstores that sell magic markers. KITP also has printers, where we could print periodic tables found on the internet. Over the course of a conference session, we color-coded the chart [left]. (We were also paying attention to the talks, we promise!)
This highlighted areas where astronomers’ knowledge shifted from “we got this” to “come back in a few years.” For example, theorists have figured out several ways to make the heavy elements just past iron, but we don’t yet know how much is contributed by each exotic-sounding process encoded in brown on the 2008 table. Since the 1950s, we have known that these heavy elements are made both by rapid neutron-capture and slow neutron-capture (r- and s- processes), but there were several candidates for the site of the r-process. It was a thrill when, in 2017, the neutron-star merger detected in both gravitational waves and electromagnetic radiation confirmed one of those sites. However, supernovae remain a possible site for r-process, particularly for the elements up through Zirconium (Zr). Dividing up the turquoise bits of the table into “merging neutron stars” and “supernovae” is one of the remaining challenges.
We did draw three definitive conclusions from this effort: (1) Jennifer’s handwriting is really bad, (2) Inese’s idea of using diagonal blocks to show the fractional contribution of each process in the lower part of the table is elegant and striking, and (3) many people have found this graphic very helpful, so thank you, KITP!
- By Jennifer Johnson, Professor of Astronomy at Ohio State University
Inese Ivans, Assistant Professor of Physics and Astronomy at University of Utah
KITP Newsletter, Spring 2019